Know your Projects Health using Key Performance Indicators (KPIs)
- Sagar Raut
- Jan 15, 2022
- 6 min read
Updated: Mar 7, 2023

Since the advent of sophisticated Project monitoring and Controlling tools, there is a huge demand for performance reporting tools in more concise and effective manner. It demands use of state-of-the-art technology such as Data cleaning, wrangling, sorting and arranging in Self explaining charts. Due to the increasing complexities in the projects, there is a requirement for easier identification of bottlenecks and flags to be addressed by Site management and C-suite managers in an organization, a simple KPIs report ensures such information is conveyed in a lucid format. Project Controls heavily depends on Key Performance Indicators (KPIs) to address the project constraints such as Time, Cost, Money & resources in order to expedite the progress as promised in baseline program submitted to client. Most of the time, KPIs should be designed considering the audience and reporting organization, as such KPIs required for Project Controls Manager or Project Manager, who is managing a single project, should be different than Program Manager or Operations Manager managing multiple projects for an organization.
What are the Key Performance Indicators (KPIs)
To quantify efforts in Project management performance measurement is done using KPIs which helps to provide useful information, timely detect problems and make judgment against certain problematic areas (Bashekal, 2011)[1]. To ensure project success, KPIs are critical for any organization or project (Swan, 2004)[2]. KPIs are referred as instruments against which various development & position the organization’s business performance is measured (Anon., 2007)[3]. KPIs are very helpful to compare performance of the project against planned considering the efficiency, workmanship, quality and effectiveness (Thoor, 2010)[4].
“With KPIs we figure out how to use this data for decision making in the future. Neither metrics not KPIs can truly predict that the project will be successful, but KPIs provide more accurate information on what might happen in the future if the existing trends continue.” (Kerzner, 2017)[5]
Importance of Earned Value Management (EVM) in producing KPIs
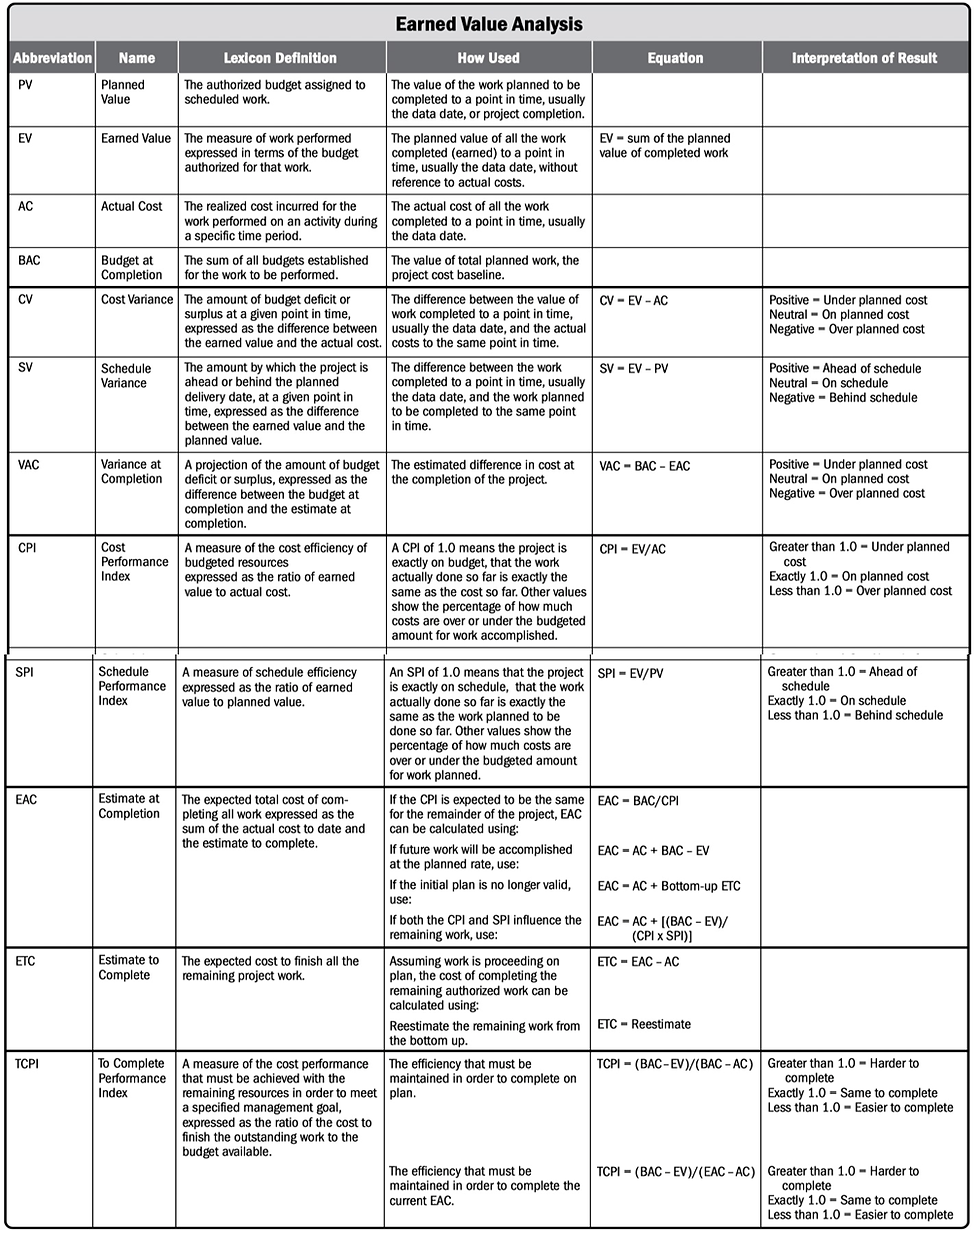
Implementation of KPIs is successfully implemented by the application of EVM. It is most sought after performance measurement methodology to measure the performance of a project on any size. EVM utilized three critical values viz., Planned Value (PV), Earned Value (EV) and Actual Cost (AC) which is further explained in Table – 1.
EVM can be successfully applied for Portfolios as well as programs, provided Project management team receives timely feedback and reports from site team(Anon., 2019)[6].
On any particular time period in a Project, EVM provides required information such as progress achieved with required resources and forecast budget for the project completion. EVM heavily depends on finding Earned Value (EV) which is the measurement of work performed expressed in terms of budget. EV is also called as Budgeted Cost of work performed (BCWP). Planned Value (PV) is the authorized budget allocated for planned work. It is also called as Budgeted Cost of Work Scheduled (BCWS). PV indicates the work that should be complete as per Schedule Baseline. Actual Cost (AC) is the incurred cost while performing the activity. This is also called as Actual Cost of Work Performed (ACWP).
Table – 1: Description of KPIs using Earned Value Analysis((PMI), 2019) [7]

(Source: Project Management Body of Knowledge (PMBOK), 6th Edition PMI USA)
How to derive & Visually present KPIs
In a complex project setup, it is always mandatory to present the project performance information in as simple and as lucid way possible for easier comprehension both for technical and non-technical staff. There are instances when Project managers and other C-level executives themselves get KPIs interpretation wrong leading to a crisis in project decision making. Figure-1 represents measurement of project performance using cumulative S-curves plotted for Planned Budget, Actual Cost spent and Earned Value. These 3 parameters are mandatory to derive KPIs related with Time and Cost, which indicates about the project status at any given point of time. The required definition and formulae are already given in Table – 1.
Figure – 1: Earned Value Graph

With reference to Figure-1, we can deduce the status of project with a simple glance with following rules:
1) At given point on “Time Now”, a cumulative Budgeted Cost of Work Performed (BCWP) curve is below the cumulative Planned Budget (BCWS) curve then Project is progressing less than Planned leading to a negative Schedule variance (SV) and SPI < 1. Hence, Project Managers should focus on increasing BCWP curve such that it will match with or remain above BCWS curve leading to a positive SV and SPI >1.
2) At given point on “Time Now”, a cumulative Budgeted Cost of Work Performed (BCWP) curve is below the cumulative Actual Cost of Work Performed (ACWP) curve then Project is spending more than the cost of work done leading to a negative Cost Variance (CV) and CPI <1. Hence, Project Managers should focus on increasing BCWP such that it will match with or remain above ACWP curve leading to a positive CV and CPI >1.
Practically, both CPI and SPI are critical KPIs for stating the Project’s health with a quick overview. Figure – 2 represents a Bull’s eye chart demarcating four regions as ‘Underspent & Late’, ‘underspent & early’, Over spent & late’, Overspent & early’. After plotting CPI and SPI for various 8 projects within an Organization, we can see below profile dividing the Projects according its performance.
Figure – 2: Bull’s Eye chart

(Source: Earned Value Management - APM Guidelines)
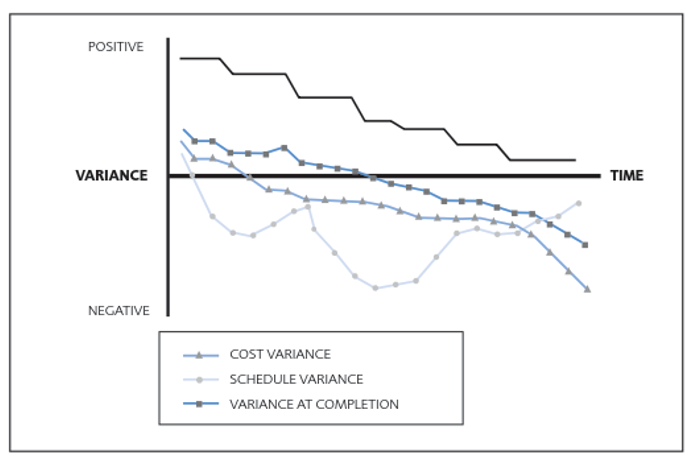
For an individual project, performance must be monitored monthly over a period of time and a simple trend analysis can be done using a Run chart as shown in Figure – 3 known as Variance analysis. It represents how a project improving or decelerating as a result of project performance. Management can take timely action after studying a trend of CV, SV & VAC over time. Accurate bottlenecks can be found out from Schedule such as activities on critical path or activities with most negative floats or Activities with highest criticality index.
Figure – 3: Variance Analysis

(Source: Earned Value Management - APM Guidelines)
Application of EVM for Portfolios, Program & Project Lifecycle
EVM can be successfully applied to Organizational strategy starting from Portfolios, Programs and projects as shown in Figure – 4, way that KPI parameters are different for each of them. For Program, each project under it are treated as ‘Components’ hence there should some weight factors for such projects to quantify the performance for overall program on a Roadmap. Program often does not have start and end milestones, hence a Benefits Transition and Realization metrics is used as KPIs to ensure the success of program. Any project which is underperforming under the such program can be traced out using Program KPIs.
EVM also applies differently in case of Portfolios performance since they also do not have fixed budget and fixed timeline, hence Organizational executives needs to heavily rely on Financial Performance of Portfolio as KPIs such as Balance Sheet, Profit and Loss accounts, Net Present Value (NPV) of cash flows, Internal Rate of Return (IRR) of investment made across various programs and individual projects under Portfolio.
Figure – 4 Hierarchy of Portfolios, Programs and Projects

(Source: The Standard for Program Management, 4th Edition, PMI USA)
Application of KPIs for overall Project Management
Apart from Time and Cost KPIs, Project Leaders should also focus on following categories of KPIs.

Conclusion
Every project should implement a strong performance measurement system using EVM to arrive at accurate KPIs. By default, Time & Cost are accepted parameters for which KPIs are calculated, however Project leadership should also track KPIs from other individual departments such as Finance, HR, Procurement, Quality etc. to ensure a collaborative effort of all project team. To ease out the work of KPIs calculations, a state of the art software should be selected easily available in the market, which will expedite the process of data collection, analysis and dashboard presentation. An Enterprise Resource Management should be tracked using KPIs so that global teams will remain focused and helpful for faster management decisions.
For more such interesting blogs, follow page here https://www.linkedin.com/company/expertprojectcontrols/
References
1. Bashekal, B. C. a. T. M., 2011. Measuring the performance of contractors in government construction projects in developing countries, Kampala, Uganda;: Uganda Management Institute.
2. Swan, W. &. K. E., 2004. An Introduction to Key Performance Indicators, Chicago: Centre for construction innovation; construction excellence.
3. Anon., 2007. Price Waterhouse Coopers (PWC).
4. Thoor, S. R. &. O. S. O., 2010. Beyond the ‘iron triangle’: Stakeholders perception of key performance indicators (KPIs) for large-scale public sector development projects. International Journal of Project Management, vol. 28 , pp. 228-236.
5. Kerzner, D. H., 2017. Project Management Metrics, KPIs and Dashboards. USA: WILEY.
6. Anon., 2019. The Standard for Earned Value Management.. In: USA: Project Management Institute (PMI).
7. (PMI), P. M. I., 2019. Project Management Body of Knowledge (PMBOK). In: 6th Edition. USA: s.n.
Disclaimer:
The views expressed in this article are those of the author and do not reflect or represent the official policy, position or recommendation of any individual or organization. Any written or verbal recommendation has a general nature and should not be used for any decision making without further assessment for specific project and organization requirements.


Comments